
The dashboard shows you everything from prompt response to how happy customers are with the solutions they receive. It helps you to discover patterns in your support workflow and find ways to make every customer interaction smoother and more satisfying.
Importance:
- Enables data-driven decisions to improve email response strategies and resource allocation
- Identifies bottlenecks and inefficiencies in email handling processes to reduce resolution time
- Helps maintain consistent service quality by monitoring agent performance and workload balance
- Track your service level agreements and keep customer satisfaction climbing higher every month
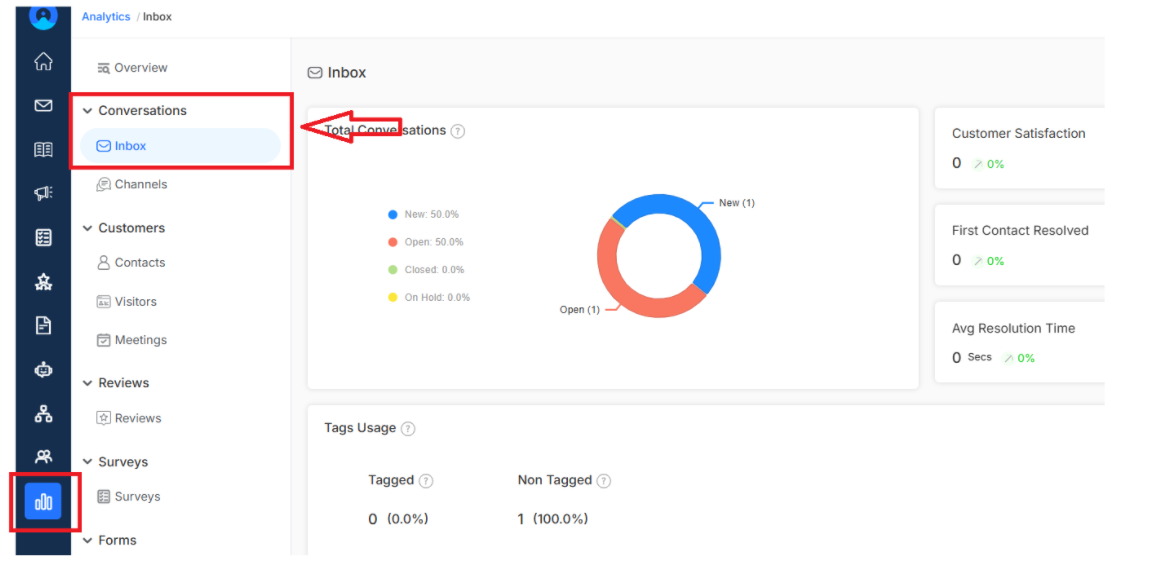
To access Inbox Reporting, navigate to Analytics for the main dashboard menu. You can find it under the Conversations
Key Metrics
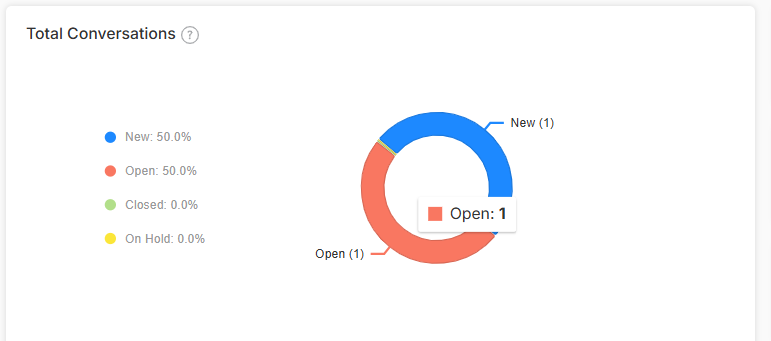
Total Conversations
See the complete volume of email interactions based on their status that your team handled. This helps you understand support demand and plan efforts efficiently
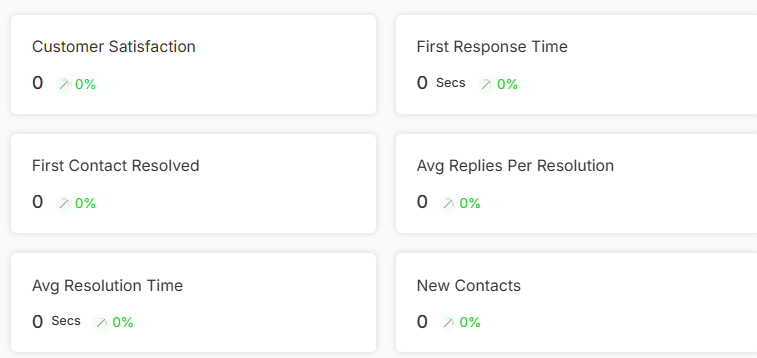
Customer Satisfaction
Track what customers really think about your support based on the score. It is the direct line to understanding service quality and finding opportunities to improve customer experience.
First Response Time
Monitor how quickly your team sends that crucial first response to customer emails. Fast initial responses show customers you care and maintain those important service level agreements.
First Contact Resolved
This metric shows what percentage of inquiries get resolved by agents, demonstrating your team's ability to provide helpful solutions.
Average Replies Per Resolution
Discover how many email exchanges it typically takes to solve customer problems to help you evaluate communication efficiency.
Average Resolution Time
Track how long it takes to completely resolve customer inquiries from start to finish. It gives you an idea of support efficiency and helps you set realistic expectations.
New Contacts
See how many first-time customers are reaching out via email to understand your business growth that might need special attention.
Tag Usage Analysis
Analyze how your team categorizes email conversations using tags to help you spot common issues, track trending topics and improve your knowledge base content.
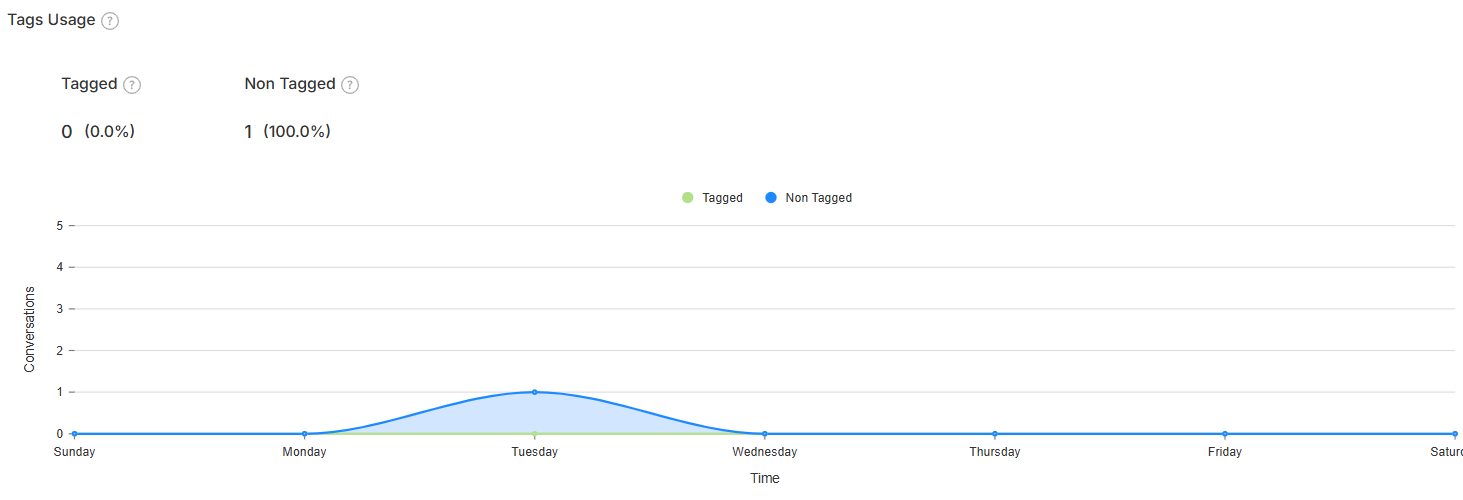
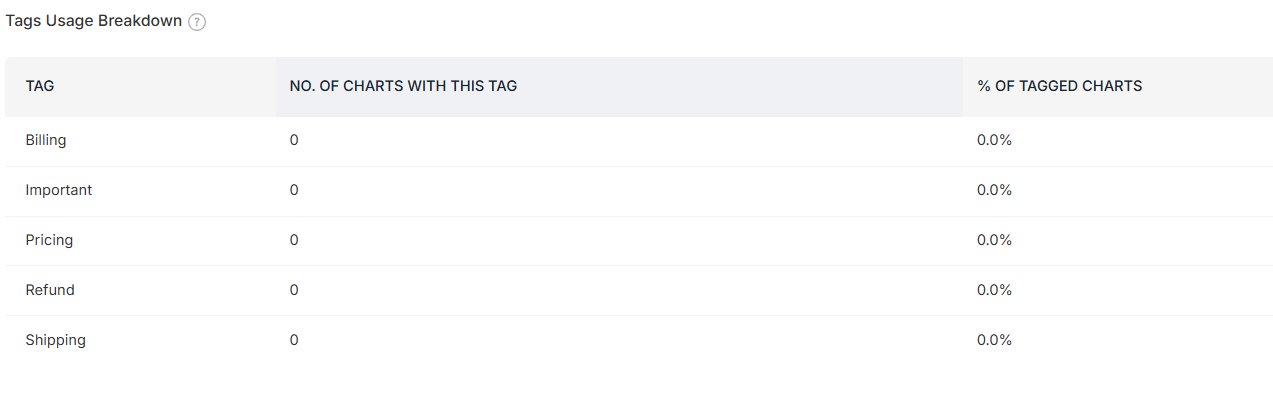
Tag Usage Breakdown
Get a detailed breakdown showing the number and percentage of conversations under each tag category. The visualization helps to understand what types of issues are most common and where to focus for improvement.
Want to learn more about managing tags effectively? Click here to discover how to add and organize tags for better email management