
This powerful dashboard shows you the exact usage of your knowledge base by your customers. You can discover which articles are most used by customers and where they are getting stuck to help you create a new topic. Let's explore the knowledge base articles on KPIs in detail
Importance of Knowledge Base Article Reporting
- Helps identify and eliminate outdated or ineffective articles
- Validates the ROI of knowledge management initiatives
- Supports continuous refinement of self-service documentation
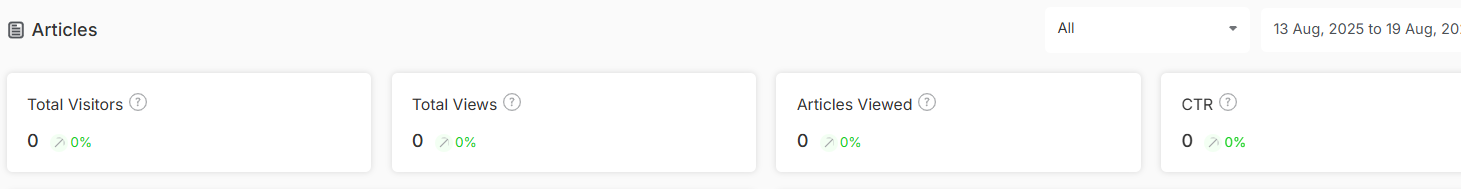
Total Visitors
You can track how many people are visiting your knowledge base to help you understand whether more customers are discovering your help center over time.
Total Views
You can track the cumulative number of times customers have accessed your knowledge base pages. High view counts mean your knowledge base is valuable enough.
Articles Accessed
Discover the number of articles your customers read during their knowledge base visits. It helps you identify where you might need to create additional content.
Click-Through Rate (CTR)
Measure the percentage of people actually click on your articles after seeing them in search results in your knowledge base.
Note: A strong CTR means your article titles and descriptions are compelling and match what people are looking for.
Search Effectiveness
You can visualize how well your knowledge base search function helps find the information viewers need.
Overall Knowledge Base Performance
Get a comprehensive score that gives you a clear picture of how effectively your knowledge base is serving your customers in solving their issues.
Top Performing Articles
This will show a list of articles that are getting the most views and attracting the most visitors. It helps you to learn from the data and use it as a reference for future articles.
What's Next?
Now that you have explored all the analytics, take your knowledge base to the next level. by
- Knowledge Base overview – Get the complete picture of your self-service strategy
- Create and manage articles. – Learn how to create and manage articles that customers actually find helpful.