
Omni24’s Metric dashboard breaks down all your KPIs so you can understand how quickly you're helping customers, solving their problems and identify any areas of improvement. Let's explore the key metrics that you can analyze to improve your business process
To access Metrics Reporting, navigate to Analytics for the main dashboard menu. You can find it under the Perform section
Key Metrics it Covers
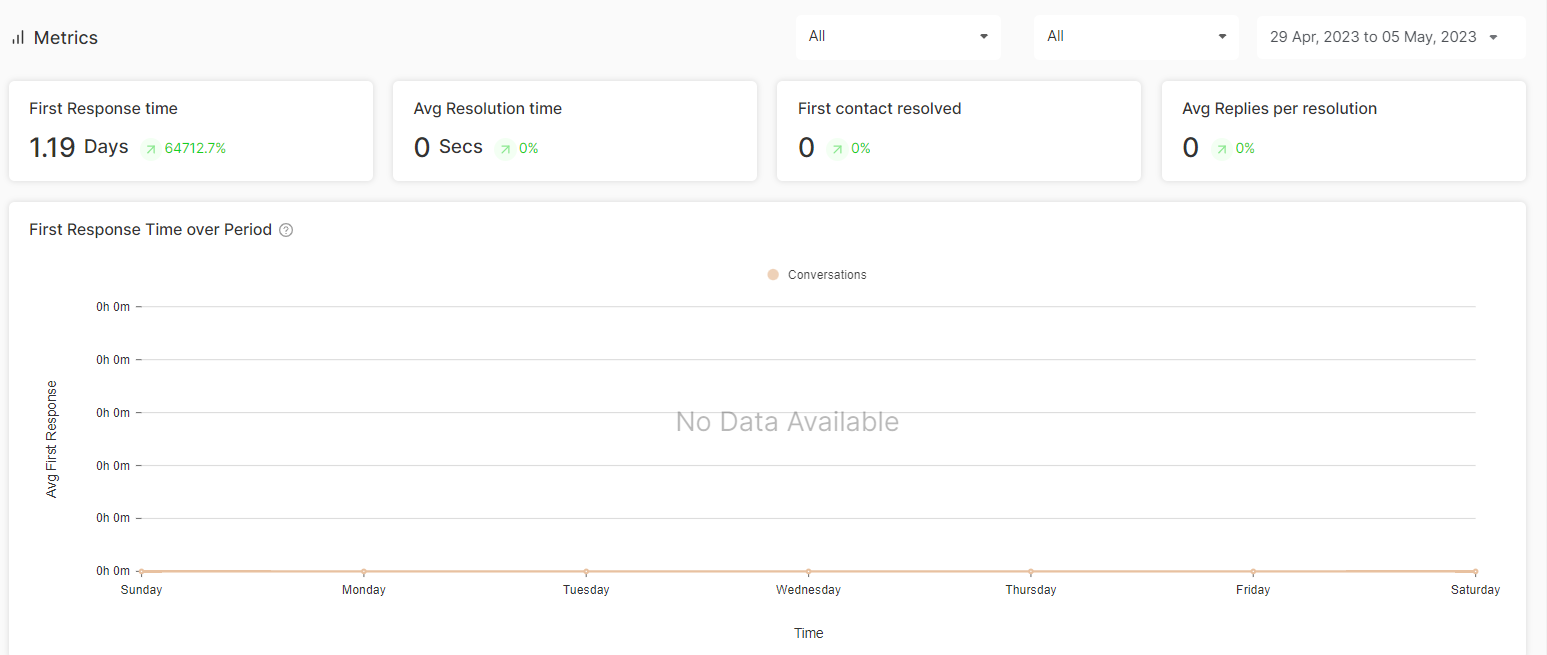
First Response Time
See how quickly your team sends that first reply to customers. Fast initial responses show customers that you are listening
Average Resolution Time
Track how long it takes your team to completely solve customer issues compared to helps you understand your team’s efficiency and set realistic expectations.
Average Replies Per Resolution
You can analyze how many back-and-forth messages it typically takes to solve customer problems. Fewer replies usually mean more efficient problem-solving and happier customers.
First Response Time Trends
Watch how your team's initial response speed changes over time with easy-to-track graphs. Spot patterns and see how your response times evolve.
Avg Resolution Time Over Period
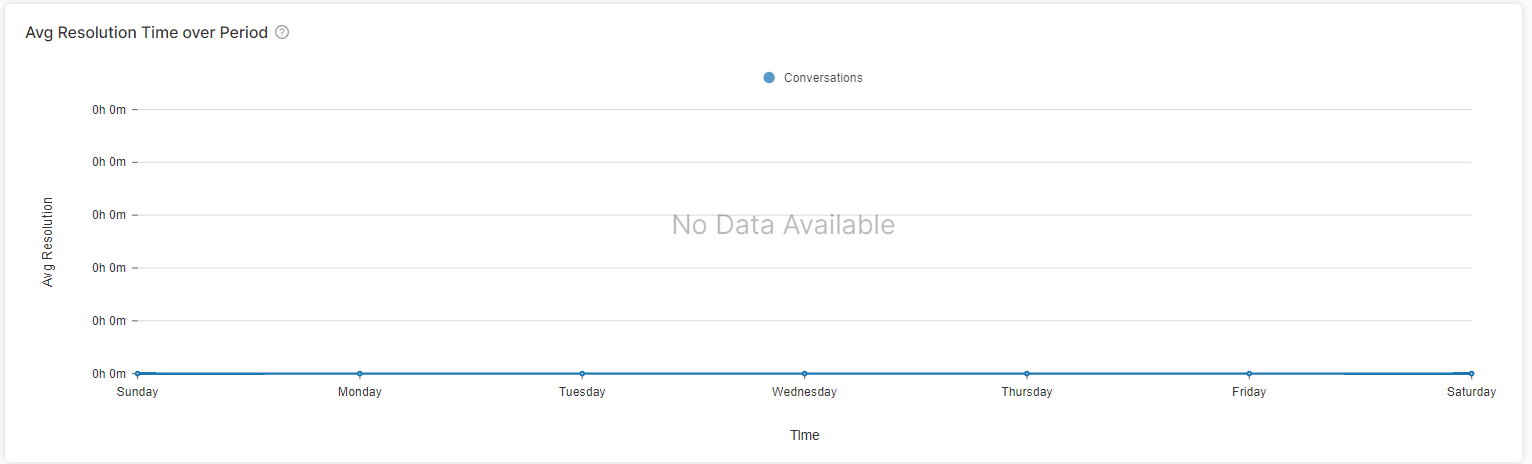
Visualize how your average issue-solving time fluctuates over selected time periods to help you understand seasonal patterns and take data-driven actions.
Response Time Analysis
Get a detailed breakdown of your first response times for conversations to help you understand not just speed, but consistency in your customer service approach.
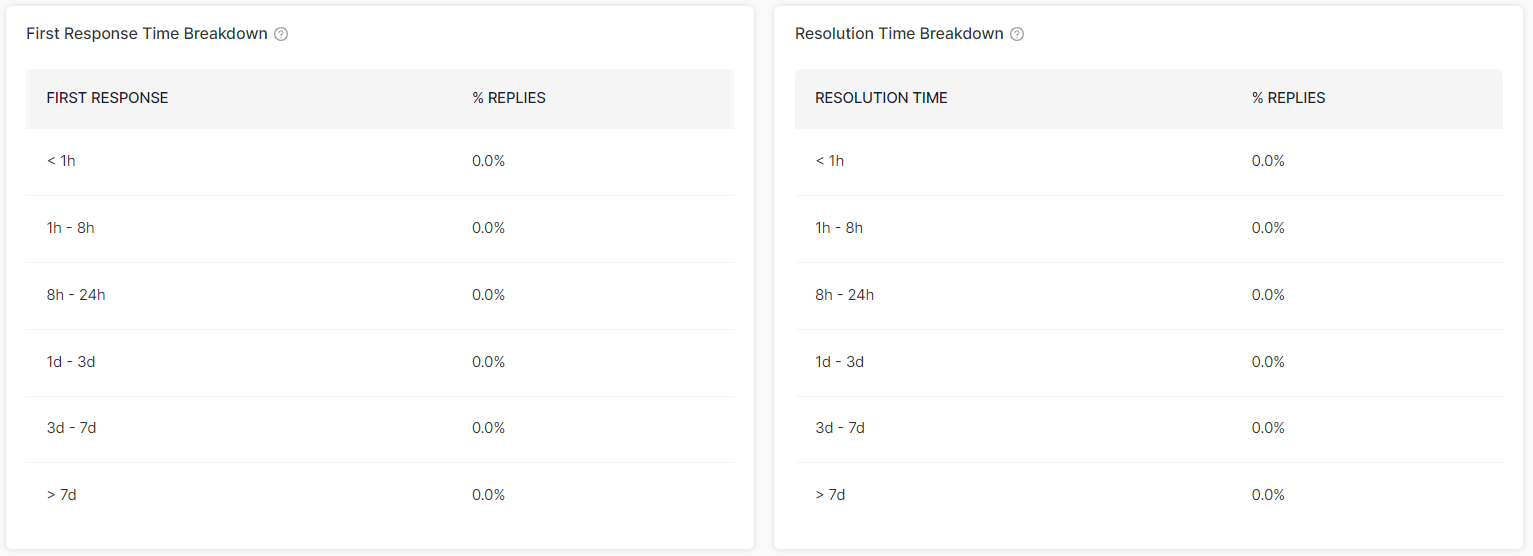
Resolution Time Analysis
See exactly how long customer issues take to resolve within specific time periods to help you identify the need for streamlined processes or additional training.
What's Next? Let's dive deeper into your customer service performance.
- Inbox reporting – Get detailed insights into your team's communication effectiveness
- User reporting – Understand individual and team performance metrics